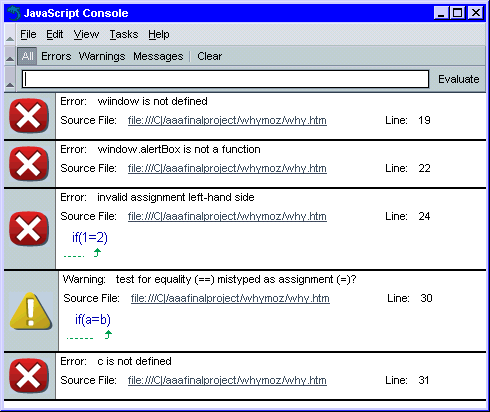
If you've only ever debugged your scripts in IE, you'll be familiar with it's poor error messages. The JavaScript console provides clearer errors, and can often show you the line where it occurred, to save searching. It is not limited to showing one error - so if your page uses a few scripts, you can see errors from all of them at once. This also provides a handy record as you fix the error. The console can also generate warnings of probable errors.
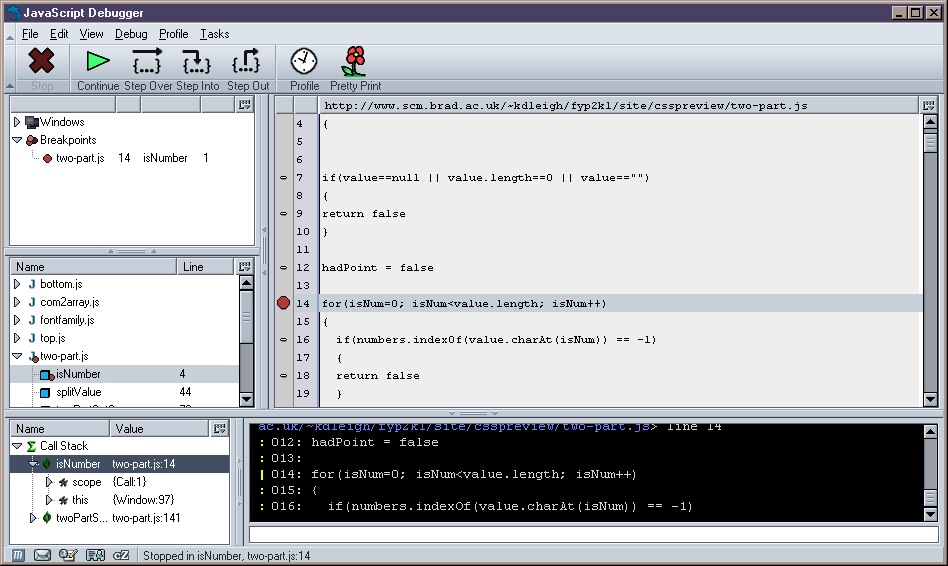
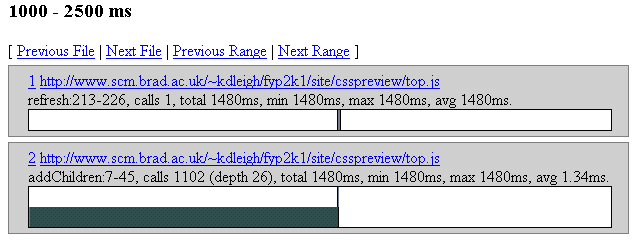
Taking the console further, the script debugger lets you examine all the functions in currently loaded scripts. Simply load the debugger before the page you want to debug (or refresh if it's already there). You should see a list appear in the debugger of all the files containing scripts, which can be expanded to reveal a list of functions. Selecting one of these functions will show its code. Next to each line of code is a mark - clicking this will set a breakpoint. If this line of code is reached, then the script will stop running, and you can examine a list of variables to see their current values. You can then stop or continue the script. Errors sent to the JavaScript console can be optionally mirrored in the debugger. You can also have your scripts profiled - showing which functions are taking up the time. The debugger has a project and a development webpage.
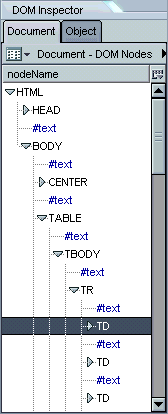
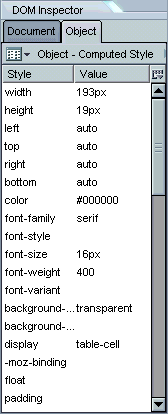
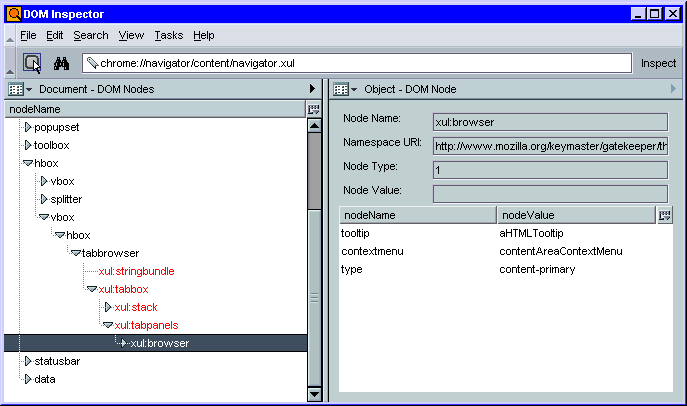
Ever wondered what's really going on in a page? The DOM inspector opens everything up. You can examine all nodes - elements and #text. You can see the currently applied attributes, the computed style, the currently applied style rules and more. This works as a separate window or as a sidebar. This is a really useful debugging tool - you can find out exactly what your scripts have generated, without writing large amounts of debug queries.
Mozilla has the best support for W3C standards of any browser. This means, if you write to the specs, it's more likely to work in Moz than anything else.
For beginners, Composer is a great tool. It lets you create pages quickly, and easily. It contains all the tools needed to make simple webpages, and contains a source editor for more advanced code. It also gives the option of creating page effects using CSS rather than the ordinary <b> and <i> tags.
Mozilla supports RFC 2397. This allows files to be embedded into the page as URLs. It allows you to encode a whole document as one file. This is used in the JavaScript Debugger to provide the profiling images. It will also eventually be possible to save a whole page as one file using this facility.
If you need to write up loads of equations in your documents, you no longer need to resort to making images of them, or spending hours with tables. Mozilla supports MathML, allowing you to easily add and view equations in your documents.
View Selection Source lets you select any part of a page, and view the current source for those elements. This lets you debug the output of scripts, by seeing what source they generated. It also lets you concentrate on the part of the page you are working on.
Use the "contact" link on the left to pester me. Also remember that not all features are in all versions. This is supposed to be up-to-date, so only complain if it doesn't work in the latest stable release.

